Grundlæggende statistik
| Institutionelle aktier (lange) | 95.763.382 - 75,25% (ex 13D/G) - change of 6,19MM shares 5,82% MRQ |
| Institutionel værdi (lang) | $ 689.266 USD ($1000) |
Institutionelt ejerskab og aktionærer
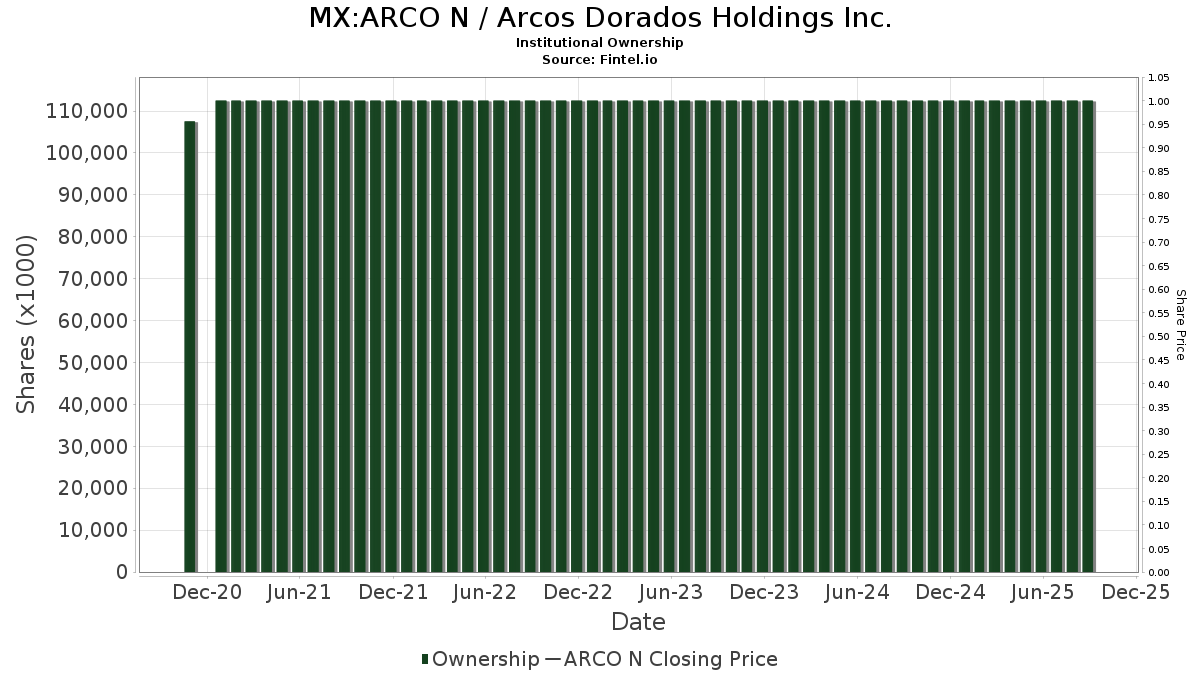
Arcos Dorados Holdings Inc. (MX:ARCO N) har 179 institutionelle ejere og aktionærer, der har indsendt 13D/G- eller 13F-formularer til Securities Exchange Commission (SEC). Disse institutioner har i alt 95,763,382 aktier. Største aktionærer omfatter Lazard Asset Management Llc, Pzena Investment Management Llc, SPX Equities Gestao de Recursos Ltda, Morgan Stanley, Moerus Capital Management LLC, Brightlight Capital Management Lp, Private Management Group Inc, ARGT - Global X MSCI Argentina ETF, MIRAE ASSET GLOBAL ETFS HOLDINGS Ltd., and TEMRX - TIAA-CREF Emerging Markets Equity Fund Retail Class .
Arcos Dorados Holdings Inc. (BMV:ARCO N) institutionel ejerskabsstruktur viser aktuelle positioner i virksomheden efter institutioner og fonde, samt seneste ændringer i positionsstørrelse. Større aktionærer kan omfatte individuelle investorer, investeringsforeninger, hedgefonde eller institutioner. Skema 13D angiver, at investoren besidder (eller besidder) mere end 5 % af virksomheden og har til hensigt (eller har til hensigt at) aktivt at forfølge en ændring i forretningsstrategi. Skema 13G indikerer en passiv investering på over 5%.
Fondens stemningsscore
Fund Sentiment Score (fka Ownership Accumulation Score) finder de aktier, der bliver mest købt af fonde. Det er resultatet af en sofistikeret, multi-faktor kvantitativ model, der identificerer virksomheder med de højeste niveauer af institutionel akkumulering. Scoringsmodellen bruger en kombination af den samlede stigning i oplyste ejere, ændringerne i porteføljeallokeringer i disse ejere og andre målinger. Tallet går fra 0 til 100, hvor højere tal indikerer et højere niveau af akkumulering for sine jævnaldrende, og 50 er gennemsnittet.
Opdateringsfrekvens: Dagligt
Se Ownership Explorer, som giver en liste over højest rangerende virksomheder.
AI+ Ask Fintel’s AI assistant about Arcos Dorados Holdings Inc..
Select a question to share a public post with an AI-crafted answer.
Thinking of good questions…
13F og NPORT arkivering
Detaljer om 13F-arkivering er gratis. Detaljer om NP-ansøgninger kræver et premium-medlemskab. Grønne rækker angiver nye positioner. Røde rækker angiver lukkede positioner. Klik på linket ikon for at se den fulde transaktionshistorik.
Opgrader
for at låse premium-data op og eksportere til Excel ![]() .
.
| Fil dato | Kilde | Investor | Type | Gennemsnitlig pris (Øst) |
Aktier | Δ Aktier (%) |
Rapporteret Værdi ($1000) |
Δ Værdi (%) |
Port Alloc (%) |
|
|---|---|---|---|---|---|---|---|---|---|---|
| 2026-02-02 | 13F | VELA Investment Management, LLC | 151.000 | 0,00 | 1.108 | 8,73 | ||||
| 2025-11-14 | 13F | Cubist Systematic Strategies, LLC | 0 | -100,00 | 0 | |||||
| 2026-02-13 | 13F | Black Creek Investment Management Inc. | 210.000 | -28,81 | 1.541 | -22,60 | ||||
| 2026-02-17 | 13F | Susquehanna International Group, Llp | Put | 0 | -100,00 | 0 | ||||
| 2026-02-11 | 13F | Franklin Resources Inc | 73.127 | -96,04 | 537 | -95,70 | ||||
| 2026-02-17 | 13F | Advisory Services Network, LLC | 0 | -100,00 | 0 | |||||
| 2026-01-29 | 13F | Sanctuary Advisors, LLC | 31.770 | 23,35 | 233 | 34,68 | ||||
| 2026-02-06 | 13F | HighTower Advisors, LLC | 22.219 | -1,53 | 163 | 7,24 | ||||
| 2026-02-10 | 13F | Bnp Paribas Arbitrage, Sa | 818.810 | -10,81 | 6.010 | -3,00 | ||||
| 2026-02-17 | 13F | Keebeck Alpha, LP | 0 | -100,00 | 0 | |||||
| 2026-02-13 | 13F | Wells Fargo & Company/mn | 362.897 | 32,17 | 2.664 | 43,71 | ||||
| 2026-02-13 | 13F | Pinnacle Wealth Planning Services, Inc. | 514 | 4 | ||||||
| 2026-01-08 | 13F | O'Keefe Stevens Advisory, Inc. | 529.728 | 2,49 | 3.888 | 11,47 | ||||
| 2026-02-17 | 13F | Clough Capital Partners L P | 147.294 | 1.081 | ||||||
| 2026-02-17 | 13F | PharVision Advisers, LLC | 41.830 | 4,96 | 307 | 14,13 | ||||
| 2026-02-19 | 13F | CI Private Wealth, LLC | 0 | -100,00 | 0 | |||||
| 2026-02-17 | 13F | Susquehanna International Group, Llp | Call | 0 | -100,00 | 0 | ||||
| 2025-10-22 | 13F | McIlrath & Eck, LLC | 0 | -100,00 | 0 | |||||
| 2026-02-06 | 13F | Gsa Capital Partners Llp | 42.211 | 61,19 | 0 | |||||
| 2026-01-23 | 13F | Penn Mutual Asset Management, LLC | 0 | -100,00 | 0 | |||||
| 2026-02-17 | 13F | Price T Rowe Associates Inc /md/ | 263.307 | 0,00 | 2 | 0,00 | ||||
| 2025-09-24 | NP | EAEMX - Parametric Emerging Markets Fund Investor Class | 8.100 | 0,00 | 54 | -13,11 | ||||
| 2025-09-26 | NP | Global Macro Capital Opportunities Portfolio - Global Macro Capital Opportunities Portfolio | 188.632 | 13,68 | 1.254 | -1,18 | ||||
| 2026-01-16 | 13F | Ronald Blue Trust, Inc. | 125 | -10,07 | 1 | |||||
| 2026-02-17 | 13F | Bayesian Capital Management, LP | 0 | -100,00 | 0 | |||||
| 2026-02-03 | 13F | Acorn Financial Advisory Services Inc /adv | 221.138 | 1,83 | 1.623 | 10,78 | ||||
| 2025-09-26 | NP | SMLF - iShares Edge MSCI Multifactor USA Small-Cap ETF | 93.967 | -43,16 | 625 | -50,63 | ||||
| 2026-01-29 | 13F | Managed Asset Portfolios, Llc | 1.476.299 | 2,73 | 10.836 | 11,71 | ||||
| 2025-10-15 | 13F | Cwm, Llc | 0 | -100,00 | 0 | |||||
| 2026-02-17 | 13F | Citadel Advisors Llc | Put | 0 | -100,00 | 0 | ||||
| 2026-01-22 | 13F | Bfsg, Llc | 24.380 | 0,21 | 179 | 8,54 | ||||
| 2025-09-25 | NP | RPGAX - T. Rowe Price Global Allocation Fund, Inc. This fund is a listed as child fund of Price T Rowe Associates Inc /md/ and if that institution has disclosed ownership in this security, then these positions will not be double counted when calculating total shares and total value | 6.865 | -50,43 | 46 | -57,14 | ||||
| 2026-02-06 | 13F | Pnc Financial Services Group, Inc. | 146 | 0,69 | 1 | |||||
| 2026-02-14 | 13F | Rockefeller Capital Management L.P. | 433.863 | 15,84 | 3.185 | 25,95 | ||||
| 2026-02-10 | 13F | CIBC World Markets Inc. | 32.350 | 20,48 | 237 | 30,94 | ||||
| 2026-02-11 | 13F | Group One Trading, L.p. | Put | 0 | -100,00 | 0 | -100,00 | |||
| 2026-02-13 | 13F | Van Eck Associates Corp | 58.661 | -0,15 | 0 | |||||
| 2026-02-17 | 13F | Schonfeld Strategic Advisors LLC | 94.706 | -43,16 | 695 | -38,17 | ||||
| 2025-09-23 | NP | SBIEX - ClearBridge International Value Fund Class A This fund is a listed as child fund of Clearbridge, Llc and if that institution has disclosed ownership in this security, then these positions will not be double counted when calculating total shares and total value | 166.262 | 0,00 | 1.106 | -13,06 | ||||
| 2025-11-14 | 13F | Two Sigma Advisers, Lp | 0 | -100,00 | 0 | |||||
| 2026-01-26 | 13F | Merit Financial Group, LLC | 32.503 | 239 | ||||||
| 2026-02-13 | 13F | Bridgefront Capital, LLC | 14.261 | -48,57 | 105 | -44,39 | ||||
| 2026-01-30 | 13F | North Star Investment Management Corp. | 755 | 0,00 | 6 | 0,00 | ||||
| 2026-02-13 | 13F | Dynamic Technology Lab Private Ltd | 23.380 | -71,48 | 171 | -69,08 | ||||
| 2026-01-26 | 13F | Chicago Capital, LLC | 17.909 | 131 | ||||||
| 2026-02-13 | 13F | State Street Corp | 36.687 | -0,24 | 269 | 8,47 | ||||
| 2026-02-05 | 13F | Atria Investments Llc | 0 | -100,00 | 0 | |||||
| 2026-02-13 | 13F | Quarry LP | 2.825 | -57,31 | 21 | -54,55 | ||||
| 2025-09-29 | NP | PRFZ - Invesco FTSE RAFI US 1500 Small-Mid ETF This fund is a listed as child fund of Invesco Ltd. and if that institution has disclosed ownership in this security, then these positions will not be double counted when calculating total shares and total value | 82.548 | -33,91 | 549 | -42,62 | ||||
| 2025-11-14 | 13F | Wolverine Trading, Llc | Put | 0 | -100,00 | 0 | -100,00 | |||
| 2025-11-21 | 13F | Nebula Research & Development LLC | 0 | -100,00 | 0 | |||||
| 2026-02-10 | 13F | Semanteon Capital Management, LP | 0 | -100,00 | 0 | |||||
| 2026-02-10 | 13F | Fideuram Asset Management (Ireland) dac | 107.625 | 771 | ||||||
| 2026-02-13 | 13F | Citigroup Inc | 171.122 | 3,24 | 1.256 | 12,34 | ||||
| 2026-02-11 | 13F | Clearbridge Investments, LLC | 831.113 | 1,92 | 6.100 | 10,83 | ||||
| 2026-02-17 | 13F | Aquatic Capital Management LLC | 8.060 | 3,60 | 59 | 13,46 | ||||
| 2025-11-13 | 13F | Russell Investments Group, Ltd. | 0 | -100,00 | 0 | |||||
| 2025-11-06 | 13F | Navellier & Associates Inc | 0 | -100,00 | 0 | -100,00 | ||||
| 2025-11-14 | 13F | Point72 Asia (Singapore) Pte. Ltd. | 1.084 | 7 | ||||||
| 2026-01-14 | 13F | Spire Wealth Management | 1.800 | -76,53 | 13 | -74,51 | ||||
| 2026-02-10 | 13F | Thompson Siegel & Walmsley Llc | 528.900 | 84,99 | 4 | 200,00 | ||||
| 2026-01-27 | 13F | WealthCollab, LLC | 408 | 3 | ||||||
| 2026-02-17 | 13F | Susquehanna International Group, Llp | 110.011 | -1,88 | 807 | 6,75 | ||||
| 2026-02-17 | 13F | Tower Research Capital LLC (TRC) | 300 | -17,13 | 2 | 0,00 | ||||
| 2025-11-10 | 13F | Adviser Investments LLC | 0 | -100,00 | 0 | |||||
| 2026-02-04 | 13F | INCA Investments LLC | 788.001 | -35,17 | 5.784 | -29,52 | ||||
| 2026-02-11 | 13F | Jpmorgan Chase & Co | 1.107.655 | -7,30 | 8.130 | 0,81 | ||||
| 2026-02-06 | 13F | Kilter Group LLC | 0 | -100,00 | 0 | |||||
| 2026-02-09 | 13F | Fidelis Capital Partners, LLC | 75.000 | 0,00 | 550 | 8,70 | ||||
| 2026-02-17 | 13F | Amundi | 784.255 | 12,51 | 5.756 | 22,89 | ||||
| 2026-02-11 | 13F | Fox Run Management, L.l.c. | 72.818 | -6,27 | 534 | 1,91 | ||||
| 2026-02-05 | 13F | Pinnacle Associates Ltd | 16.600 | 0,00 | 122 | 8,04 | ||||
| 2026-02-06 | 13F | Pzena Investment Management Llc | 10.562.564 | -7,57 | 77.529 | 0,51 | ||||
| 2026-02-12 | 13F | Steward Partners Investment Advisory, Llc | 700 | 0,00 | 5 | 25,00 | ||||
| 2026-02-13 | 13F | Squarepoint Ops LLC | 78.581 | -44,77 | 577 | -40,00 | ||||
| 2026-02-03 | 13F | NewEdge Wealth, LLC | 17.929 | 24,71 | 132 | 28,43 | ||||
| 2026-02-04 | 13F | West Tower Group, LLC | 158.736 | 0,00 | 1.165 | 8,78 | ||||
| 2025-09-25 | NP | VMMSX - Vanguard Emerging Markets Select Stock Fund Investor Shares | 400.303 | 2.662 | ||||||
| 2026-02-12 | 13F | Jane Street Group, Llc | Call | 35.200 | -61,78 | 258 | -58,45 | |||
| 2026-02-12 | 13F | Jane Street Group, Llc | 401.309 | 591,70 | 2.946 | 653,20 | ||||
| 2026-02-17 | 13F | Janus Henderson Group Plc | 19.465 | -0,59 | 143 | 7,58 | ||||
| 2025-09-26 | NP | MSTFX - Morningstar International Equity Fund | 74.333 | 787,77 | 494 | 671,88 | ||||
| 2026-02-11 | 13F | Simplex Trading, Llc | 70 | -99,81 | 1 | |||||
| 2026-02-10 | 13F | Envestnet Asset Management Inc | 369.470 | 21,30 | 2.712 | 31,86 | ||||
| 2026-02-11 | 13F | Simplex Trading, Llc | Call | 34.400 | 391,43 | 252 | ||||
| 2026-02-06 | 13F | Handelsbanken Fonder AB | 240.928 | 0,00 | 2 | 0,00 | ||||
| 2026-02-24 | 13F | DGS Capital Management, LLC | 13.481 | 10,58 | 99 | 19,51 | ||||
| 2026-02-12 | 13F | Moerus Capital Management LLC | 3.556.906 | 6,81 | 26.108 | 16,15 | ||||
| 2026-02-17 | 13F | Point72 Asset Management, L.P. | 588.072 | 2.347,44 | 4.316 | 2.564,20 | ||||
| 2026-02-05 | 13F | Sapient Capital Llc | 245.501 | 0,00 | 1.790 | 6,55 | ||||
| 2026-02-13 | 13F | Barclays Plc | 479 | 4 | ||||||
| 2026-02-17 | 13F | Aspen Grove Capital, LLC | 16.332 | -10,01 | 120 | -2,46 | ||||
| 2026-01-20 | 13F | Perpetual Ltd | 1.447.814 | -16,57 | 10.627 | -9,29 | ||||
| 2025-11-12 | 13F | Nuveen, LLC | 0 | -100,00 | 0 | |||||
| 2026-02-10 | 13F | Dumac, Inc. | 60.857 | 0,00 | 447 | -7,08 | ||||
| 2026-02-17 | 13F | NorthRock Partners, LLC | 10.000 | 73 | ||||||
| 2026-02-17 | 13F | Lazard Asset Management Llc | 21.471.672 | 6,67 | 157.602 | 16,00 | ||||
| 2026-02-17 | 13F | Regal Investment Advisors LLC | 20.032 | 147 | ||||||
| 2026-02-06 | 13F | Global Retirement Partners, LLC | 5.780 | 9.074,60 | 42 | |||||
| 2026-02-13 | 13F | Stifel Financial Corp | 62.922 | -16,78 | 462 | -9,61 | ||||
| 2026-02-17 | 13F | Cetera Investment Advisers | 11.791 | -3,68 | 87 | 4,88 | ||||
| 2026-02-12 | 13F | BlackRock, Inc. | 32.468 | -96,44 | 238 | -96,13 | ||||
| 2026-02-02 | 13F | Truist Financial Corp | 10.402 | 76 | ||||||
| 2026-02-10 | 13F | Root Financial Partners, LLC | 0 | -100,00 | 0 | |||||
| 2026-02-17 | 13F | Royal Bank Of Canada | 507.461 | 12,50 | 3.724 | 22,34 | ||||
| 2025-11-14 | 13F | Wolverine Trading, Llc | Call | 22.900 | 157 | |||||
| 2025-09-22 | NP | TEOOX - Transamerica Emerging Markets Opportunities R6 | 281.400 | 8,06 | 1.871 | -6,07 | ||||
| 2026-02-17 | 13F | Delaware Management Holdings, Inc. | 54.469 | 400 | ||||||
| 2025-10-31 | 13F | Whittier Trust Co | 0 | -100,00 | 0 | |||||
| 2026-02-17 | 13F | Raymond James Financial Inc | 68.365 | 1,28 | 502 | 10,11 | ||||
| 2026-02-17 | 13F | D. E. Shaw & Co., Inc. | 289.725 | -22,11 | 2.127 | -15,30 | ||||
| 2026-02-06 | 13F | TimesSquare Capital Management, LLC | 549.322 | -16,36 | 4.032 | -9,05 | ||||
| 2026-02-06 | 13F | FourThought Financial Partners, LLC | 23.458 | 172 | ||||||
| 2026-02-17 | 13F | Millennium Management Llc | 77.462 | -88,02 | 569 | -86,98 | ||||
| 2026-01-09 | 13F | Seafarer Capital Partners, LLC | 400.000 | 0,00 | 2.936 | 8,74 | ||||
| 2026-01-30 | 13F | State of New Jersey Common Pension Fund D | 1.486.822 | 0,00 | 10.913 | 8,74 | ||||
| 2026-03-06 | 13F | Hsbc Holdings Plc | 23.855 | -80,38 | 175 | -78,65 | ||||
| 2026-02-11 | 13F | Group One Trading, L.p. | Call | 51.600 | 54,95 | 379 | 68,75 | |||
| 2026-02-13 | 13F | Dodge & Cox | 112.966 | 2,73 | 829 | 11,73 | ||||
| 2026-02-13 | 13F | Morgan Stanley | 4.045.638 | 14,29 | 29.695 | 24,27 | ||||
| 2025-10-02 | 13F/A | Mirabella Financial Services Llp | 62.227 | 502 | ||||||
| 2026-02-13 | 13F | General American Investors Co Inc | 950.178 | 35,71 | 6.974 | 47,57 | ||||
| 2025-09-25 | NP | PRLAX - T. Rowe Price Latin America Fund This fund is a listed as child fund of Price T Rowe Associates Inc /md/ and if that institution has disclosed ownership in this security, then these positions will not be double counted when calculating total shares and total value | 258.100 | 10,35 | 1.716 | -4,08 | ||||
| 2026-02-10 | 13F | Goldman Sachs Group Inc | 1.127.060 | 83,09 | 8.273 | 99,09 | ||||
| 2026-02-17 | 13F | Citadel Advisors Llc | Call | 40.800 | -23,45 | 299 | -16,71 | |||
| 2025-09-29 | NP | GTDDX - INVESCO Developing Markets Fund Class A | 0 | -100,00 | 0 | -100,00 | ||||
| 2026-02-17 | 13F | Citadel Advisors Llc | 927.535 | -3,01 | 6.808 | 5,47 | ||||
| 2026-02-11 | 13F | CenterBook Partners LP | 182.931 | 1.343 | ||||||
| 2026-01-21 | 13F | Inlet Private Wealth, LLC | 384.188 | -6,75 | 2.820 | 1,40 | ||||
| 2026-02-13 | 13F | Sei Investments Co | 1.496.461 | 9.401,94 | 10.984 | 10.262,26 | ||||
| 2026-02-17 | 13F | PDT Partners, LLC | 330.780 | -24,56 | 2.428 | -17,98 | ||||
| 2026-01-30 | 13F | Citizens Financial Group Inc/ri | 20.737 | 0,82 | 152 | 10,14 | ||||
| 2026-02-12 | 13F | Wealthspire Advisors, LLC | 0 | -100,00 | 0 | |||||
| 2026-02-13 | 13F | Boston Partners | 298.262 | 2,32 | 2.189 | 11,29 | ||||
| 2025-09-26 | NP | SUNAMERICA SERIES TRUST - SA Legg Mason Tactical Opportunities Portfolio Class 1 | 2.363 | -28,39 | 16 | -40,00 | ||||
| 2026-02-17 | 13F | Boothbay Fund Management, Llc | 27.408 | 11,79 | 201 | 21,82 | ||||
| 2026-02-17 | 13F | Jones Financial Companies Lllp | 2.831 | 1,07 | 21 | 5,26 | ||||
| 2025-11-12 | 13F | Ramirez Asset Management, Inc. | 0 | -100,00 | 0 | |||||
| 2025-09-29 | NP | ARGT - Global X MSCI Argentina ETF This fund is a listed as child fund of Mirae Asset Global Investments Co., Ltd. and if that institution has disclosed ownership in this security, then these positions will not be double counted when calculating total shares and total value | 3.240.935 | -3,91 | 21.552 | -16,47 | ||||
| 2026-02-09 | 13F | Optimize Financial Inc | 86.291 | 1,46 | 633 | 10,28 | ||||
| 2026-02-17 | 13F | Wiley Bros.-aintree Capital, Llc | 22.070 | 25,31 | 162 | 36,44 | ||||
| 2026-02-17 | 13F | Engineers Gate Manager LP | 116.214 | 481,74 | 853 | 536,57 | ||||
| 2026-02-09 | 13F | Huntington National Bank | 546 | 22,42 | 4 | 33,33 | ||||
| 2025-11-13 | 13F | Banco BTG Pactual S.A. | 0 | -100,00 | 0 | |||||
| 2025-11-05 | 13F | Renaissance Group Llc | 0 | -100,00 | 0 | |||||
| 2025-09-18 | NP | SFVLX - Seafarer Overseas Value Fund Investor Class | 260.000 | 30,00 | 1.729 | 13,01 | ||||
| 2026-01-23 | 13F | Assetmark, Inc | 57 | 0 | ||||||
| 2025-11-14 | 13F | Sofos Investments, Inc. | 0 | -100,00 | 0 | |||||
| 2026-02-17 | 13F | ExodusPoint Capital Management, LP | 0 | -100,00 | 0 | -100,00 | ||||
| 2026-02-17 | 13F | Tudor Investment Corp Et Al | 0 | -100,00 | 0 | -100,00 | ||||
| 2026-02-12 | 13F | Renaissance Technologies Llc | 1.049.734 | 312,74 | 7.705 | 349,01 | ||||
| 2026-01-26 | 13F | Quattro Financial Advisors Llc | 20.555 | 0,00 | 151 | 8,70 | ||||
| 2026-02-17 | 13F | Auxier Asset Management | 398.992 | 7,86 | 2.929 | 17,31 | ||||
| 2026-02-17 | 13F | Warren Averett Asset Management, LLC | 13.108 | 20,03 | 96 | 31,51 | ||||
| 2026-02-17 | 13F | Public Employees Retirement System Of Ohio | 3.405 | 4,58 | 25 | 14,29 | ||||
| 2026-01-05 | 13F | Confluence Investment Management Llc | 10.613 | -24,58 | 78 | -18,09 | ||||
| 2026-02-10 | 13F | Ritter Daniher Financial Advisory LLC / DE | 1.055 | 8 | ||||||
| 2026-02-17 | 13F | Trexquant Investment LP | 152.799 | -1,16 | 1.122 | 7,48 | ||||
| 2026-02-10 | 13F | Moors & Cabot, Inc. | 49.409 | 4,27 | 363 | 13,48 | ||||
| 2026-01-30 | 13F | Us Bancorp \de\ | 1.359 | 3,35 | 10 | 12,50 | ||||
| 2026-02-10 | 13F | Catalyst Capital Advisors LLC | 182.090 | 0,00 | 1.337 | 8,71 | ||||
| 2026-01-27 | 13F | Hedges Asset Management LLC | 287.900 | -3,74 | 2.113 | 4,71 | ||||
| 2026-01-29 | 13F | UBS Group AG | 518.530 | 21,56 | 3.806 | 32,20 | ||||
| 2025-10-30 | 13F | Covestor Ltd | 0 | -100,00 | 0 | |||||
| 2026-02-20 | 13F | Sunbelt Securities, Inc. | 54 | 0,00 | 0 | |||||
| 2026-02-17 | 13F | Northern Trust Corp | 83.795 | -0,03 | 615 | 8,85 | ||||
| 2026-02-12 | 13F | Campbell & CO Investment Adviser LLC | 11.228 | -21,80 | 82 | -14,58 | ||||
| 2026-01-27 | 13F | Proffitt & Goodson Inc | 0 | -100,00 | 0 | |||||
| 2025-11-14 | 13F | Fred Alger Management, Llc | 0 | -100,00 | 0 | |||||
| 2026-01-30 | 13F | American Capital Advisory, LLC | 187.809 | -32,23 | 1.379 | -26,31 | ||||
| 2026-02-13 | 13F | SPX Equities Gestao de Recursos Ltda | 7.551.676 | 19,06 | 55.429 | 29,47 | ||||
| 2026-02-17 | 13F | American Trust Investment Advisors, LLC | 209.313 | 4,85 | 1.536 | 14,03 | ||||
| 2026-01-30 | 13F | NJ State Employees Deferred Compensation Plan | 0 | -100,00 | 0 | |||||
| 2026-02-17 | 13F | Balyasny Asset Management Llc | 145.111 | 1.065 | ||||||
| 2026-01-29 | 13F | First Interstate Bank | 19.020 | 0,00 | 140 | 8,59 | ||||
| 2026-02-10 | 13F | Quantbot Technologies LP | 36.662 | -64,43 | 269 | -61,29 | ||||
| 2025-09-26 | NP | TEMRX - TIAA-CREF Emerging Markets Equity Fund Retail Class | 2.134.572 | -35,14 | 14.195 | -43,62 | ||||
| 2026-02-13 | 13F | Tower Bridge Advisors | 11.068 | 0,00 | 81 | 9,46 | ||||
| 2026-02-17 | 13F | Jump Financial, LLC | 51.332 | -53,73 | 377 | -49,73 | ||||
| 2026-02-17 | 13F | Qube Research & Technologies Ltd | 598.162 | 32,34 | 4.391 | 43,93 | ||||
| 2026-02-17 | 13F | Fmr Llc | 1 | 0 | ||||||
| 2025-11-14 | 13F | Petrus Trust Company, LTA | 0 | -100,00 | 0 | |||||
| 2025-10-09 | 13F | Harbour Capital Advisors, LLC | 0 | -100,00 | 0 | |||||
| 2026-02-17 | 13F | Magnetar Financial LLC | 0 | -100,00 | 0 | |||||
| 2026-02-17 | 13F | Brightlight Capital Management Lp | 3.466.800 | 55,18 | 25.446 | 68,75 | ||||
| 2026-01-28 | 13F | Ruffer LLP | 127.142 | 0,00 | 935 | 8,86 | ||||
| 2026-02-17 | 13F | XTX Topco Ltd | 177.326 | 1.302 | ||||||
| 2026-02-12 | 13F | Skopos Labs, Inc. | 30.458 | 223 | ||||||
| 2026-02-13 | 13F | Absolute Gestao de Investimentos Ltda. | 154.584 | 1.135 | ||||||
| 2025-11-13 | 13F | Epoch Investment Partners, Inc. | 0 | -100,00 | 0 | |||||
| 2026-02-13 | 13F | Macquarie Group Ltd | 0 | -100,00 | 0 | |||||
| 2025-11-12 | 13F | Group One Trading, L.p. | 0 | -100,00 | 0 | -100,00 | ||||
| 2026-02-17 | 13F | State Of Wisconsin Investment Board | 41.590 | 305 | ||||||
| 2026-02-23 | 13F | Virtu Financial LLC | 0 | -100,00 | 0 | |||||
| 2025-11-17 | 13F | Hancock Whitney Corp | 0 | -100,00 | 0 | |||||
| 2026-02-06 | 13F | Mraz, Amerine & Associates, Inc. | 19.665 | 11,32 | 144 | 21,01 | ||||
| 2026-02-17 | 13F | MIRAE ASSET GLOBAL ETFS HOLDINGS Ltd. | 2.699.452 | 2,61 | 19.814 | 11,58 | ||||
| 2026-02-11 | 13F | Winton Capital Group Ltd | 0 | -100,00 | 0 | |||||
| 2026-02-05 | 13F | Allworth Financial LP | 55 | 0,00 | 0 | |||||
| 2026-01-28 | 13F | Financial Perspectives, Inc | 102 | 0,00 | 1 | |||||
| 2025-09-15 | 13F/A | Charles Schwab Investment Management Inc | 0 | -100,00 | 0 | |||||
| 2026-01-21 | 13F | Baker Ellis Asset Management LLC | 53.300 | 19,78 | 391 | 30,33 | ||||
| 2026-02-18 | 13F | GWM Advisors LLC | 0 | -100,00 | 0 | |||||
| 2026-02-02 | 13F | WJ Financial Advisors LLC | 31.620 | 232 | ||||||
| 2026-02-23 | 13F | Leonteq Securities AG | 0 | -100,00 | 0 | |||||
| 2026-02-11 | 13F | Private Management Group Inc | 3.378.055 | -0,04 | 24.795 | 8,70 | ||||
| 2026-01-28 | 13F | N.E.W. Advisory Services LLC | 376 | 0,80 | 3 | 0,00 | ||||
| 2026-02-09 | 13F | Morningstar Investment Management LLC | 0 | -100,00 | 0 | |||||
| 2026-02-13 | 13F | Arkadios Wealth Advisors | 11.851 | 5,62 | 87 | 14,67 | ||||
| 2026-02-10 | 13F | Globeflex Capital L P | 815.609 | 0,00 | 5.987 | 8,74 | ||||
| 2026-01-12 | 13F | Abound Wealth Management | 1.427 | 0,00 | 10 | 11,11 | ||||
| 2026-02-11 | 13F | Simplex Trading, Llc | Put | 0 | -100,00 | 0 | ||||
| 2026-01-29 | 13F | Deltec Asset Management Llc | 155.400 | -6,61 | 1.141 | 1,51 | ||||
| 2026-01-30 | 13F | R Squared Ltd | 14.212 | -4,47 | 104 | 4,00 | ||||
| 2026-01-23 | 13F | Palouse Capital Management, Inc. | 256 | 2 | ||||||
| 2025-09-25 | NP | PRIDX - T. Rowe Price International Discovery Fund This fund is a listed as child fund of Price T Rowe Associates Inc /md/ and if that institution has disclosed ownership in this security, then these positions will not be double counted when calculating total shares and total value | 1.563.367 | 6,33 | 10.396 | -7,57 | ||||
| 2026-01-23 | 13F | Diligent Investors, LLC | 27.619 | -1,76 | 203 | 6,88 | ||||
| 2026-02-09 | 13F | MTM Investment Management, LLC | 500 | 0,00 | 4 | 0,00 | ||||
| 2026-02-13 | 13F | Verition Fund Management LLC | 105.385 | -28,40 | 774 | -22,16 | ||||
| 2026-02-10 | 13F | Bank of New York Mellon Corp | 43.393 | 34,11 | 319 | 45,87 | ||||
| 2026-02-17 | 13F | Bank Of America Corp /de/ | 528.403 | 2,54 | 3.878 | 11,50 | ||||
| 2026-02-06 | 13F | Verde Servicos Internacionais S.A. | 0 | -100,00 | 0 | |||||
| 2026-02-09 | 13F | Bleakley Financial Group, LLC | 203.855 | -2,18 | 1.496 | 6,40 | ||||
| 2026-02-13 | 13F | Ubs Oconnor Llc | 0 | -100,00 | 0 | |||||
| 2026-02-13 | 13F | Caitong International Asset Management Co., Ltd | 0 | -100,00 | 0 | |||||
| 2025-11-14 | 13F | Northwestern Mutual Wealth Management Co | 0 | -100,00 | 0 | |||||
| 2026-02-11 | 13F | LPL Financial LLC | 33.295 | 17,90 | 244 | 28,42 | ||||
| 2026-01-15 | 13F | Lodestone Wealth Management LLC | 115 | 1 | ||||||
| 2026-02-13 | 13F | Golden State Wealth Management, LLC | 0 | -100,00 | 0 | |||||
| 2026-02-19 | 13F | Invesco Ltd. | 982.026 | -4,04 | 7.208 | 4,36 | ||||
| 2026-02-12 | 13F | Hrt Financial Lp | 58.535 | -21,69 | 0 | |||||
| 2026-02-17 | 13F | Advisor Group Holdings, Inc. | 2.365 | 1,90 | 17 | 6,25 | ||||
| 2026-02-17 | 13F | Voloridge Investment Management, Llc | 0 | -100,00 | 0 | |||||
| 2026-02-17 | 13F | Prelude Capital Management, Llc | 11.228 | -6,41 | 82 | 2,50 | ||||
| 2026-02-02 | 13F | Hussman Strategic Advisors, Inc. | 105.000 | 771 | ||||||
| 2026-01-07 | 13F | Emeth Value Capital, LLC | 1.045.701 | -47,02 | 7.675 | -42,39 | ||||
| 2026-01-27 | 13F | TD Waterhouse Canada Inc. | 14 | 1.300,00 | 0 | |||||
| 2025-09-25 | NP | CBLS - Clough Hedged Equity ETF | 141.994 | 21,58 | 944 | 5,71 |